Solving and analyzing a model: the diet problem
This example shows you how to create and solve a Python-based model by using a sample.
About this task
This well-known optimization problem identifies the best mix of foodstuffs to meet dietary requirements while minimizing costs. The data inputs are the nutritional profile and price of different foods and the min and max values for nutrients in a diet. The model is expressed as the minimization of a linear program. The files that are used in this sample are available in the DO-samples.
- Add a Machine Learning service to your project. You can either add this service at the project level (see Creating a Watson Machine Learning Service instance), or you can add it when you first create a new Decision Optimization experiment: click Add a Machine Learning service, select, or create a New service, click Associate, then close the window.
- Associate a deployment space with your Decision Optimization experiment (see Deployment spaces). A deployment space can be created or selected when you first create a new Decision Optimization experiment: click Create a deployment space, enter a name for your deployment space, and click Create. For existing models, you can also create, or select a space in the Overview information pane.
Procedure
To create and solve a Python-based model by using a sample:
-
In the Prepare data
view, you can see the data assets
imported.
These tables represent the min and max values for nutrients in the diet (
diet_nutrients), the nutrients in different foods (diet_food_nutrients), and the price and quantity of specific foods (diet_food).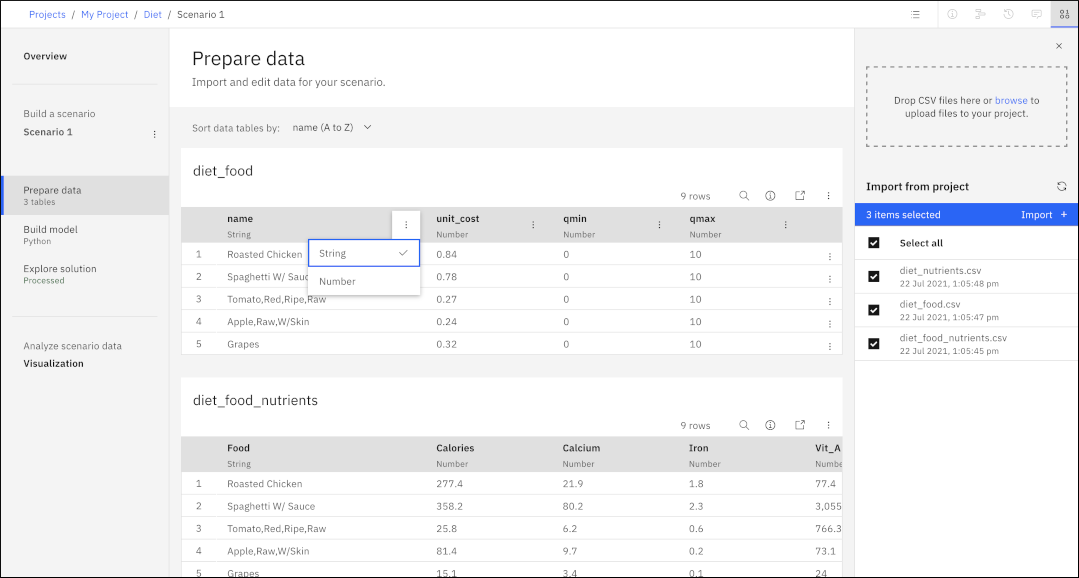
-
Click Build model in the
sidebar to view your model.
The Python model minimizes the cost of the food in the diet while satisfying minimum nutrient and calorie requirements.
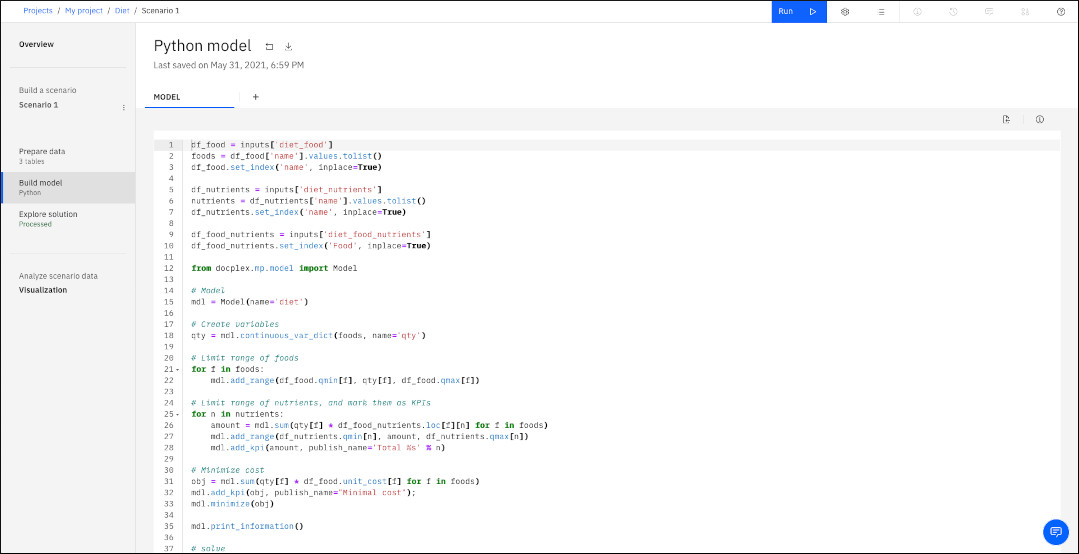
Note also how the inputs (tables in the Prepare data view) and the outputs (in this case the solution table to be displayed in the Explore solution view) are specified in this model.
Results
When the run is completed, you can see the results in the Explore solution view. You can also click Engine statistics or Log to see the solution chart and inspect the solver engine log files. The first tab in the Explore solution view shows the objective (or objectives if you have several) with its values and weights. The Solution tables tab provides you with a list of foods and their quantities, along with the nutrients that they provide.
You can also download the solution tables as csv files.
If your model had any conflicting constraints, these would be shown in the Conflicts tab with the Relaxations necessary to solve the model.
In the Visualization view, the solution is displayed as a table and a chart in the Solution page. You can add notes, different types of tables and charts to show input data, solution data or KPIs by selecting and editing the widgets. You can also create different pages in the Visualization view. For example, an Input page is also provided in this sample. See Visualization view.
You're ready to start running comparisons between different scenarios. For example, the basic solution contains a quantity of hot dog. You might want to check an alternate solution for someone who prefers a vegetarian diet.