[ Nav ] Incompatible combination of context ( icp4data ) and deployment_target ( cloud )
Chart builder
Last updated: Feb 11, 2025
Working with your data in SPSS Modeler
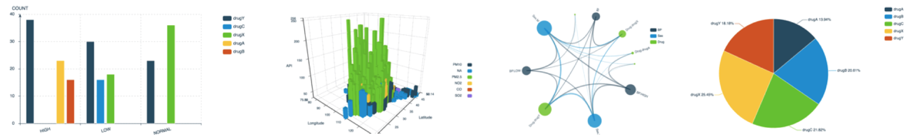
You can use a Charts node to start the chart builder. In the chart builder, you can use
advanced visualizations to explore your data from different perspectives and identify patterns,
connections, and relationships within your data.
You can also visualize your data with these same charts in a Data Refinery flow.Figure 1. Sample visualizations available for a flow