Creating a scatterplot
Last updated: Oct 09, 2024
Now let's take a look at what factors might influence
, the target variable.
As a researcher, you know that the concentrations of sodium and potassium in the blood are important
factors. Since these are both numeric values, you can create a scatterplot of sodium versus
potassium, using the drug categories as a color overlay.Drug

- Place a Plot node on the canvas and connect it to the drug1n.csv Data Asset node. Then double-click the Plot node to edit its properties.
- Select
as the X field,Na
as the Y field, andK
as the Color (overlay) field. Click Save, then right-click the Plot node and select Run. A plot chart is added to the Outputs pane.Drug
The plot clearly shows a threshold above which the correct drug is always drug
and below which the correct drug is never drugY
. This threshold is a ratio -- the ratio of sodium (Y
) to potassium (Na
).K
Figure 2. Scatterplot of drug distribution
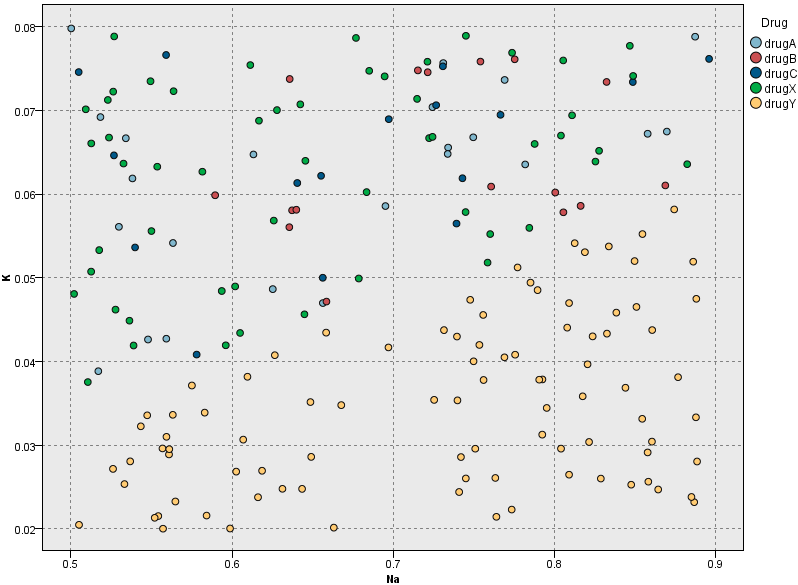
Was the topic helpful?
0/1000