Examining the data
Last updated: Oct 09, 2024
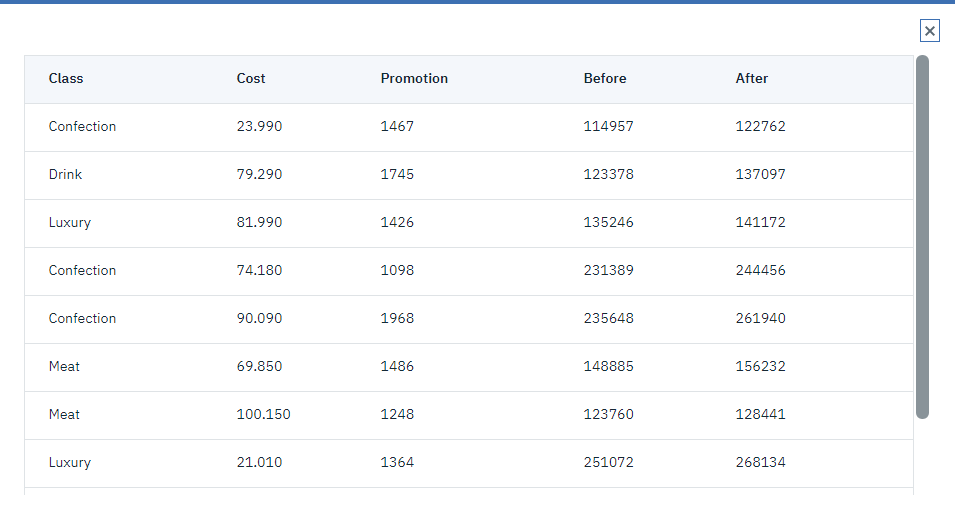
Each record contains:
ClassCostPromotionBeforeAfter
The flow is simple. It displays the data in a table. The two revenue fields
(BeforeAfter
The flow also contains a node to derive this value, expressed as a percentage of the revenue
before the promotion, in a field called Increase
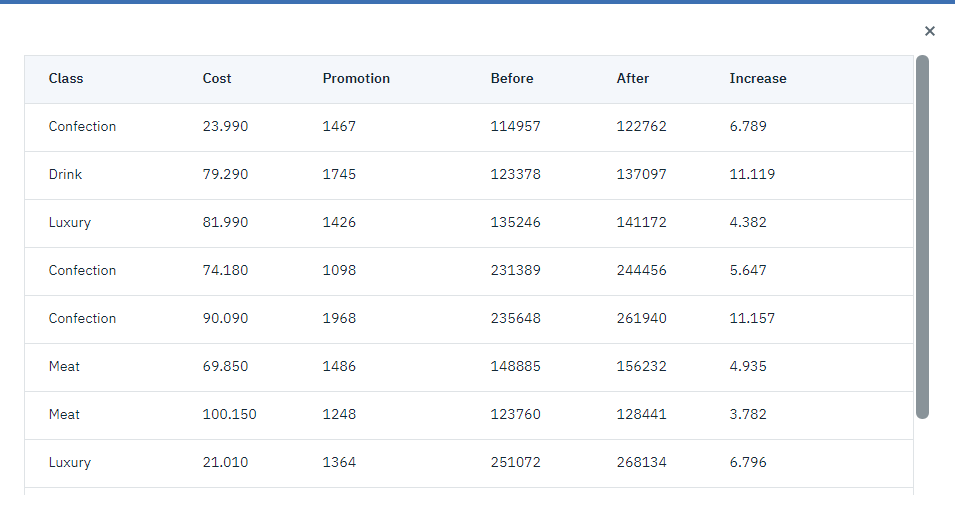
For each class of product, and almost linear relationship exists between the increase in revenue and the cost of the promotion. Therefore, it seems likely that a decision tree or neural network could predict, with reasonable accuracy, the increase in revenue from the other available fields.
Was the topic helpful?
0/1000