Quick start: Analyze data in a Jupyter notebook
You can create a notebook in which you run code to prepare, visualize, and analyze data, or build and train a model. Read about Jupyter notebooks, then watch a video and take a tutorial that’s suitable for users with some knowledge of Python code.
- Required service
- watsonx.ai Studio
Your basic workflow includes these tasks:
- Create a project. Projects are where you can collaborate with others to work with data.
- Add your data to the project. You can add CSV files or data from a remote data source through a connection.
- Create a notebook in the project.
- Add code to the notebook to load and analyze your data.
- Run your notebook and share the results with your colleagues.
Read about notebooks
A Jupyter notebook is a web-based environment for interactive computing. You can run small pieces of code that process your data, and you can immediately view the results of your computation. Notebooks include all of the building blocks you need to work with data:
- The data
- The code computations that process the data
- Visualizations of the results
- Text and rich media to enhance understanding
Watch a video about notebooks
 Watch this video to learn the basics of Jupyter notebooks.
This video provides a visual method to learn the concepts and tasks in this documentation.
Try a tutorial to create a notebook
In this tutorial, you will complete these tasks:
- Task 1: Open a project.
- Task 2: Add a notebook to your project.
- Task 3: Load a file and save the notebook.
- Task 4: Find and edit the notebook.
- Task 5: Share read-only version of the notebook.
- Task 6: Schedule a notebook to run at a different time.
This tutorial will take approximately 15 minutes to complete.
Tips for completing this tutorial
Here are some tips for successfully completing this tutorial.
Use the video picture-in-picture
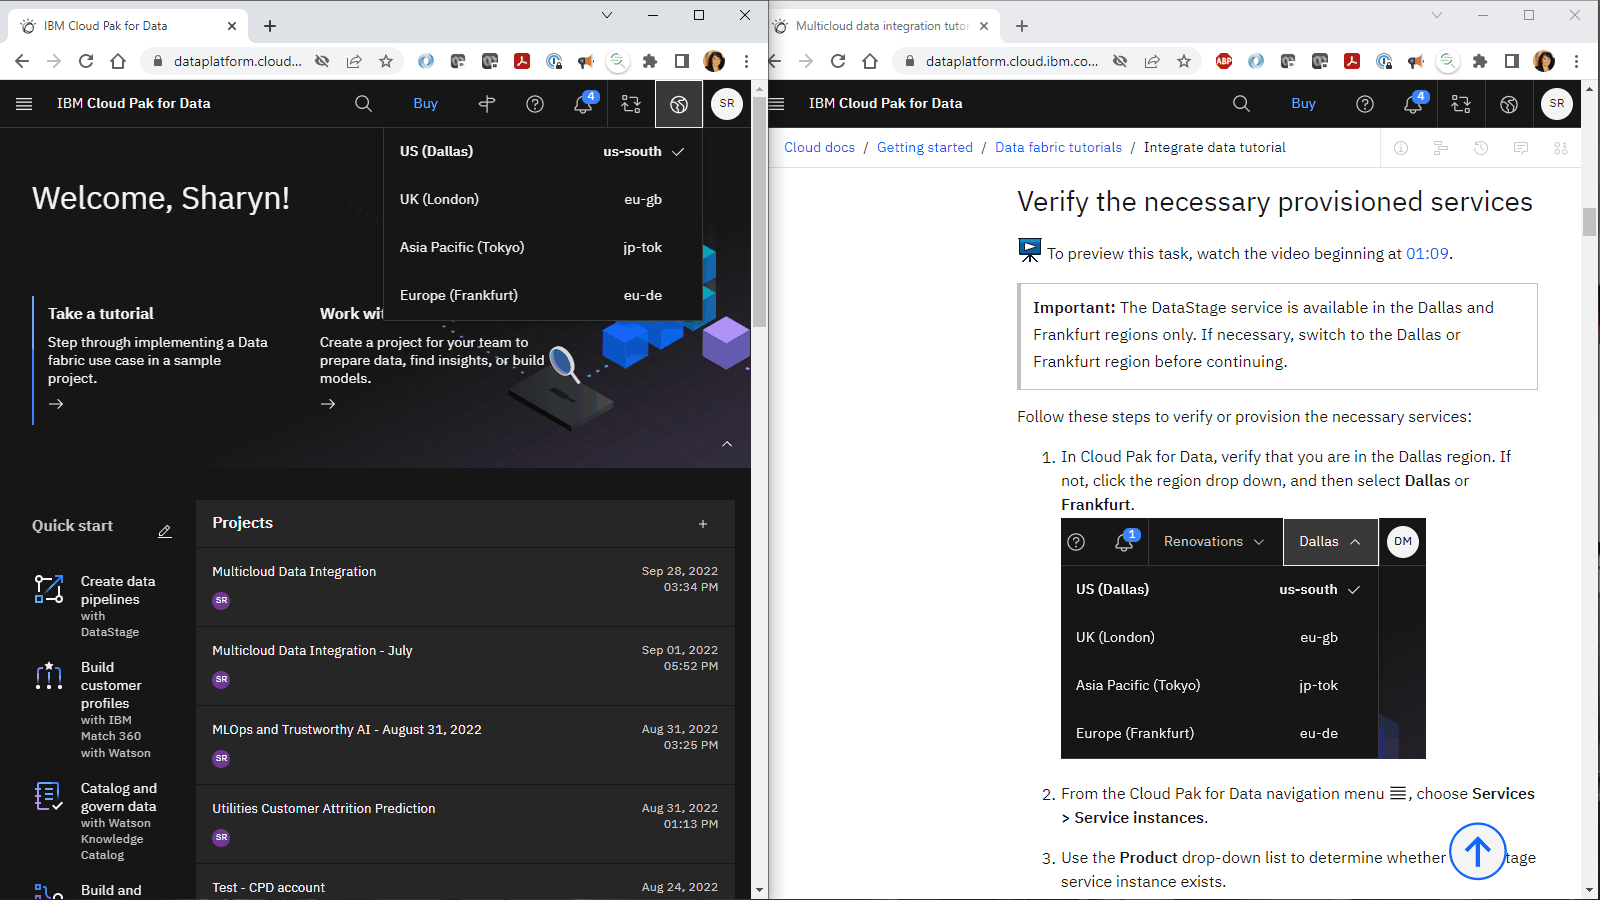
The following animated image shows how to use the video picture-in-picture and table of contents features:

Get help in the community
If you need help with this tutorial, you can ask a question or find an answer in the Cloud Pak for Data Community discussion forum.
Set up your browser windows
For the optimal experience completing this tutorial, open Cloud Pak for Data in one browser window, and keep this tutorial page open in another browser window to switch easily between the two applications. Consider arranging the two browser windows side-by-side to make it easier to follow along.

Task 1: Open a project
You need a project to store the notebook and data asset. You can use an existing project or create a project. Follow these steps to open a project and add a data asset to the project:
-
From the Navigation Menu
, choose Projects > View all projects
-
Open an existing project. If you want to use a new project:
-
Click New project.
-
Select Create an empty project.
-
Enter a name and optional description for the project.
-
Choose an existing object storage service instance or create a new one.
-
Click Create.
-
-
From the Navigation Menu
, click Resource hub.
-
Search for an interesting data set, and select the data set.
-
Click Add to project.
-
Select the project from the list, and click Add.
-
After the data set is added, click View Project.
-
In the project, click the Assets tab to see the data set.
For more information, see Creating a project.
For more information adding Resource hub assets to a project to access in a notebook, see Loading and accessing data in a notebook.
 Check your progress
The following image shows the Assets tab in the project.

Task 2: Add a notebook to your project
 To preview this task, watch the video beginning at 00:06.
Follow these steps to create a new notebook in your project.
-
In your project, on the Assets tab, click New asset > Work with data and models in Python or R notebooks.
-
Type a name and description (optional).
-
Select a runtime environment for this notebook.
-
Click Create. Wait for the notebook editor to load.
 Check your progress
The following image shows blank notebook.

Task 3: Load a file and save the notebook
 To preview this task, watch the video beginning at 00:23.
Now you can access the data asset in your notebook that you uploaded to your project earlier. Follow these steps to load data into a data frame:
-
Click in an empty code cell in your notebook.
-
Click the Code snippets icon (
 ).
). -
In the side pane, click Read data.
-
Click Select data from project.
-
Locate the data asset from the project, and click Select.
-
In the Load as drop-down list, select the load option that you prefer.
-
Click Insert code to cell. The code to read and load the data asset is inserted into the cell.
-
Click the Run icon
to run your code. The first few rows of your data set will display.
-
To save a version of your notebook, click File > Save Version. You can also just save your notebook with File > Save.
 Check your progress
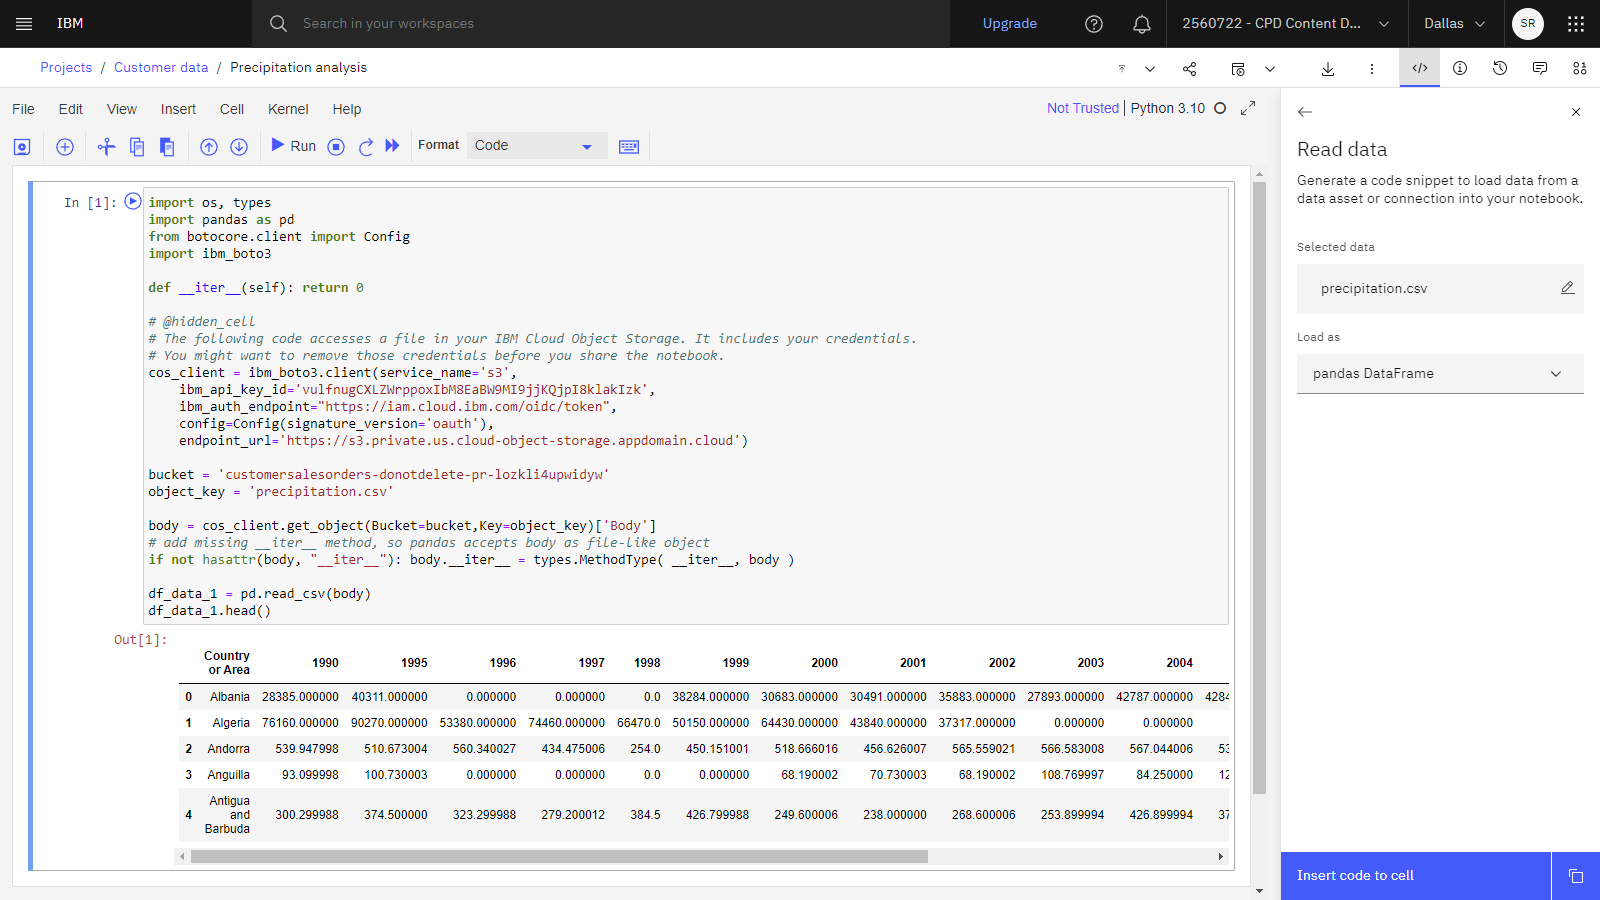
The following image shows the notebook with the pandas DataFrame.

Task 4: Find and edit the notebook
 To preview this task, watch the video beginning at 01:19.
Follow these steps to locate the saved notebook on the Assets tab, and edit the notebook:
-
In the project navigation trail, click your project name to return to your project.
-
Click the Assets tab to find the notebook.
-
When you click the notebook, it will open in
READ ONLYmode. -
To edit the notebook, click the pencil icon
.
-
Click the Information icon
to open the Information panel.
-
On the General tab, edit the name and description of the notebook.
-
Click the Environment tab to see how you can change the environment used to run the notebook or update the runtime status to either stop and restart.
 Check your progress
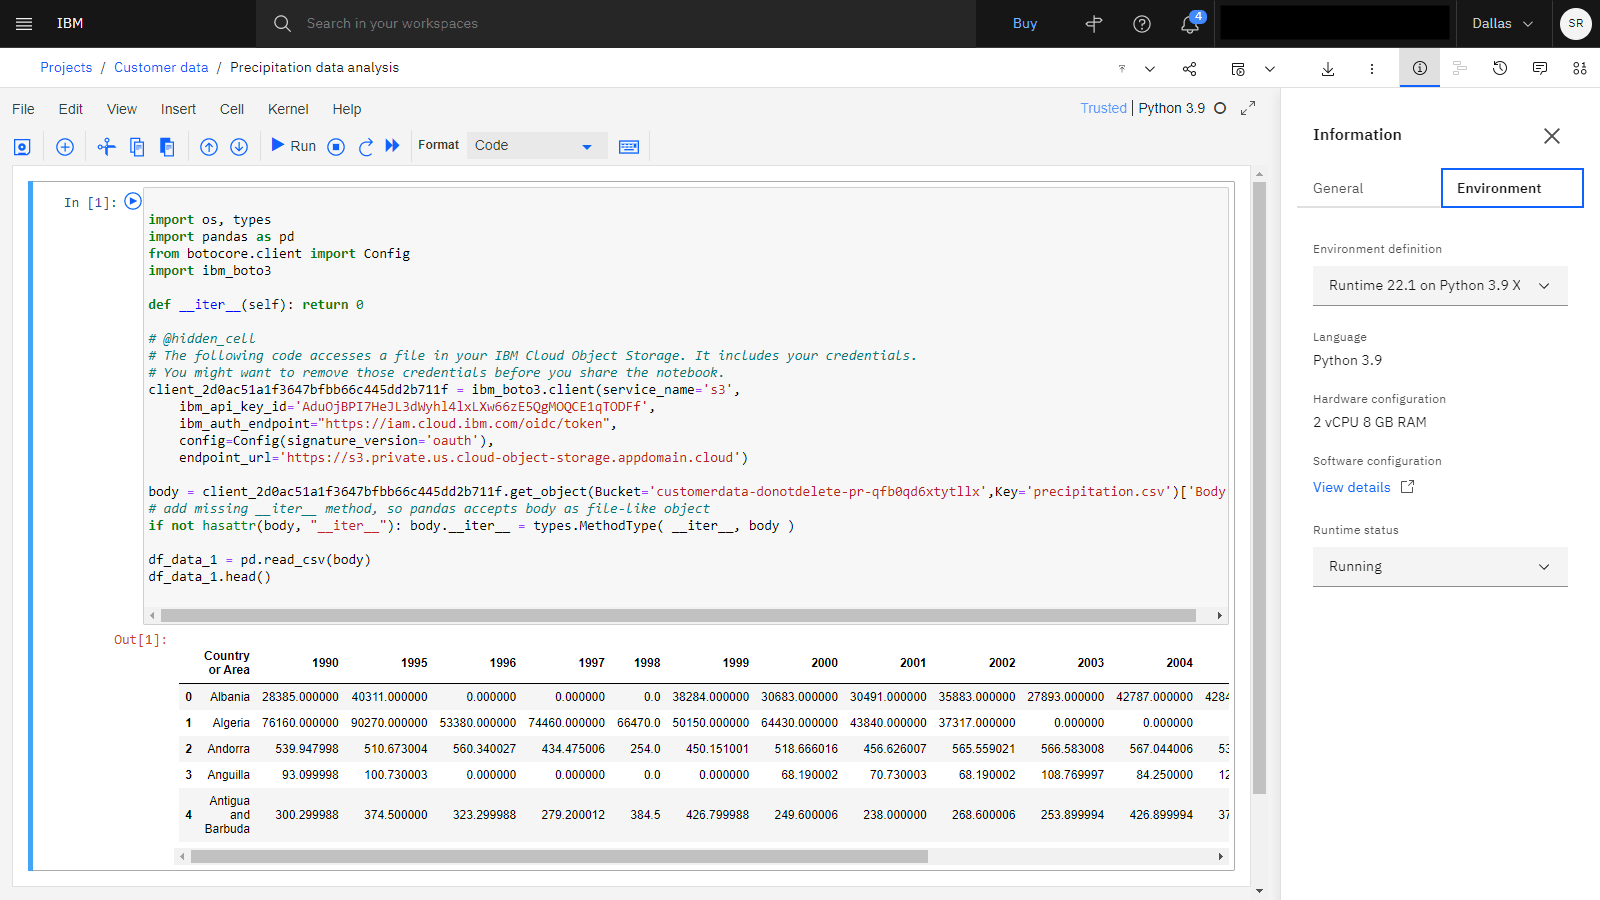
The following image shows the notebook with the Information panel displayed.

Task 5: Share read-only version of the notebook
 To preview this task, watch the video beginning at 01:52.
Follow these steps to create a link to the notebook to share with colleagues:
-
Click the Share icon
if you would like to share the read-only view of the notebook.
-
Click to turn on the Share with anyone who has the link toggle button.
-
Select what content you would like to share through a link or social media.
-
Click the Copy icon
to copy a direct link to this notebook.
-
Click Close.
 Check your progress
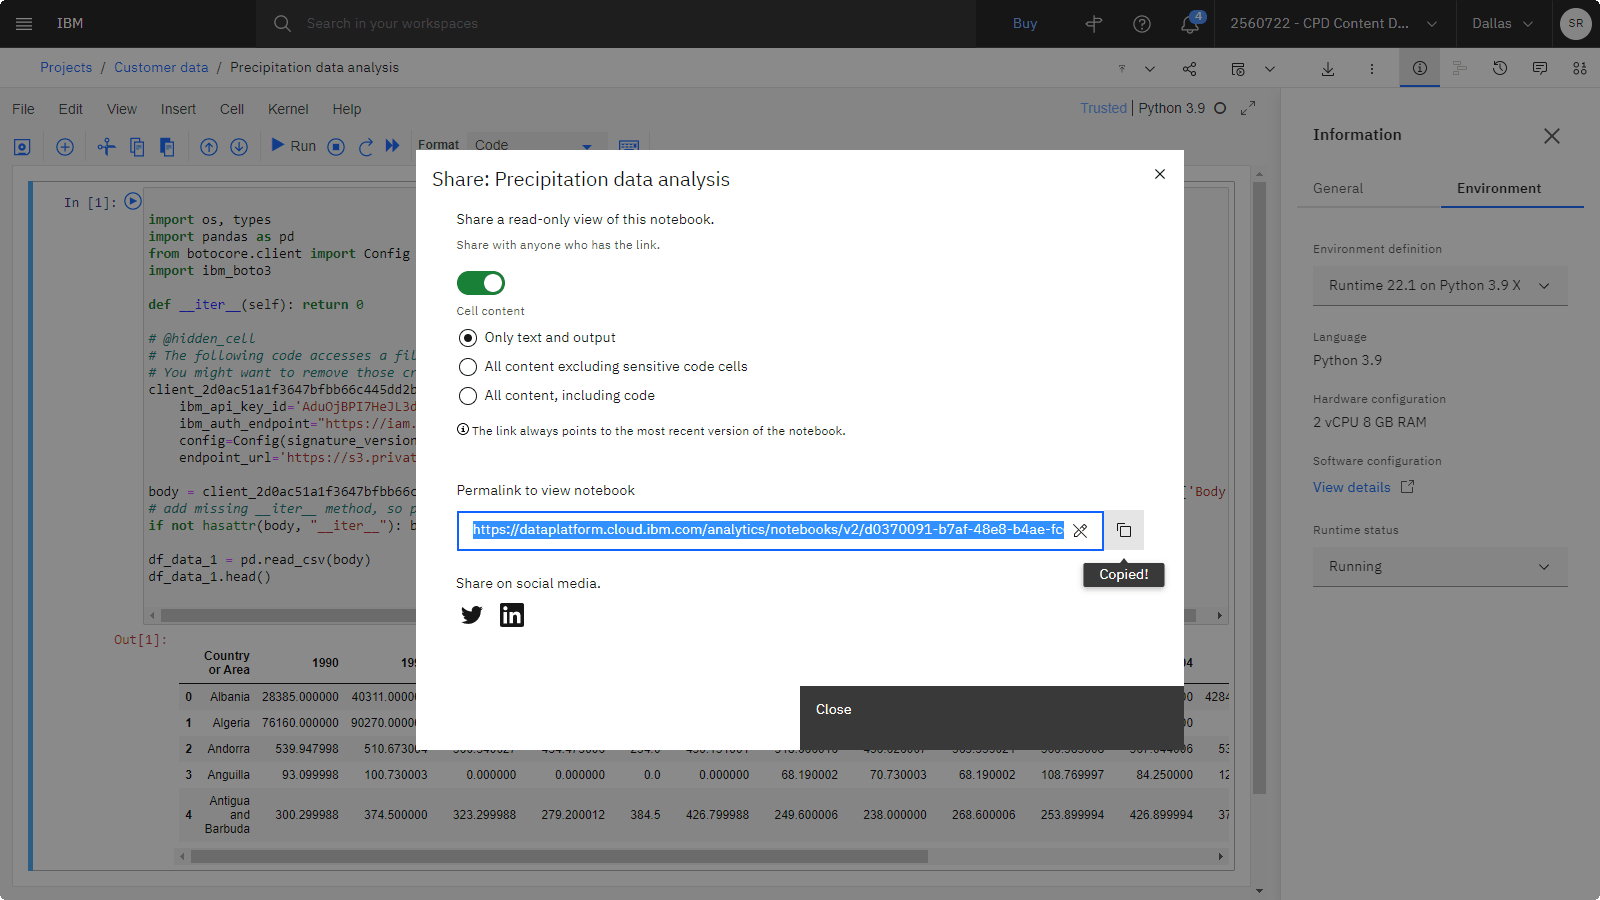
The following image shows the Share dialog box.

Task 6: Schedule a notebook to run at a different time
 To preview this task, watch the video beginning at 02:08.
Follow these steps to create a job to schedule the notebook to run at a specific time or repeat based on a schedule:
-
Click the Jobs icon, and select Create a job.

-
Provide the name and description of the job, and click Next.
-
Select the notebook version and environment runtime, and click Next.
-
(Optional) Click the toggle button to schedule a run. Specify the date, time and if you would like the job to repeat, and click Next.
-
(Optional) click the toggle button to receive notifications for this job, and click Next.
-
Review the details, and click either Create (to create the job, but not run the job immediately) or Create and run (to run the job immediately).
-
The job will display in the Jobs tab in the project.
 Check your progress
The following image shows the Jobs tab.

Next steps
Now you can use this data set for further analysis. For example, you or other users can do any of these tasks:
Additional resources
-
View more videos.
-
Find sample data sets and notebooks to gain hands-on experience refining data in the Resource hub.
-
Expedite working with your data using the industry accelerators provided by IBM which are a set of end-to-end solutions that you can run as examples or customize them to address common business issues. Most accelerators include a Sample project with everything you need to analyze data, build a model, and display results.
Parent topic: Quick start tutorials